Marching Squares Renderer
Somehow, I managed to bounce around even more this week, but ended up settling on implementing Marching Squares for a web-based grid renderer.
Marching Squares
The Marching Squares algorithm is a way of interpreting a 2D grid of points as a set of tiles, which sit between the points. A Marching Squares renderer takes in a grid of points with values of 0 or 1. A 0 represents a point that is "outside" of the shape, and a 1 represents a point that is "inside" of the shape. The algorithm then "marches" over each cell in the grid (a cell is a 2x2 square of points), and places one of 16 possible tiles in each cell. If everything is working correctly, the tiles will line up and form a shape where all "inside" points are inside the shape and all the "outside" points are outside the shape.
The Grid
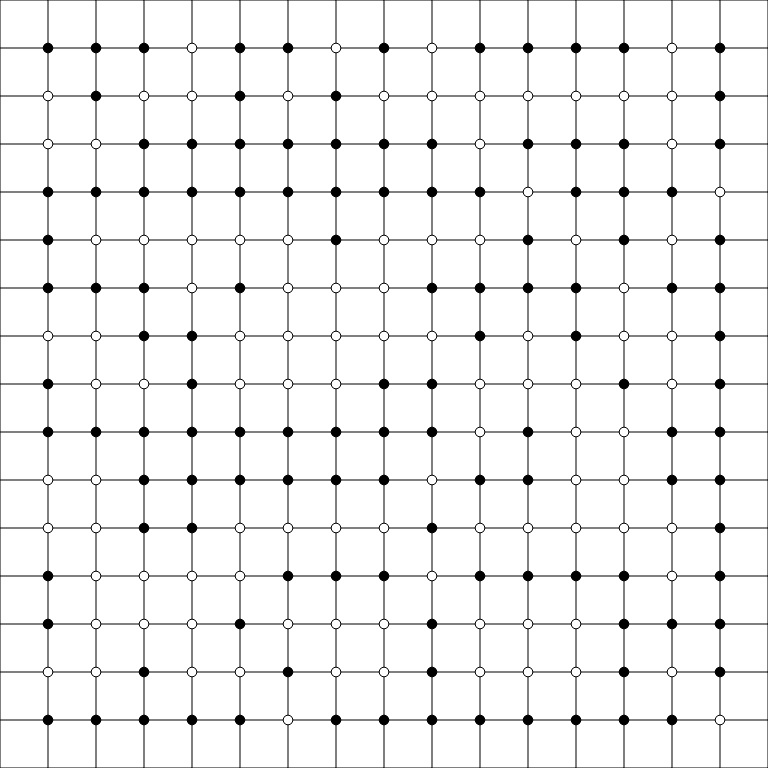
We start with a grid of points. Each point has a value of 0 or 1. Here's an example grid, where each 1 is represented by a filled black circle and each 0 is represented by an empty white circle. Here, we have a grid with most points randomly set to 0 or 1:
 A grid of random points
The points that lie on the edges of the grid above are always set to 0, to ensure that the entire shape fits inside of the grid. They're not rendered on the grid here, but they will be considered when determining which tile to render for the cells on the edges.
The 16 Possible Cell Values
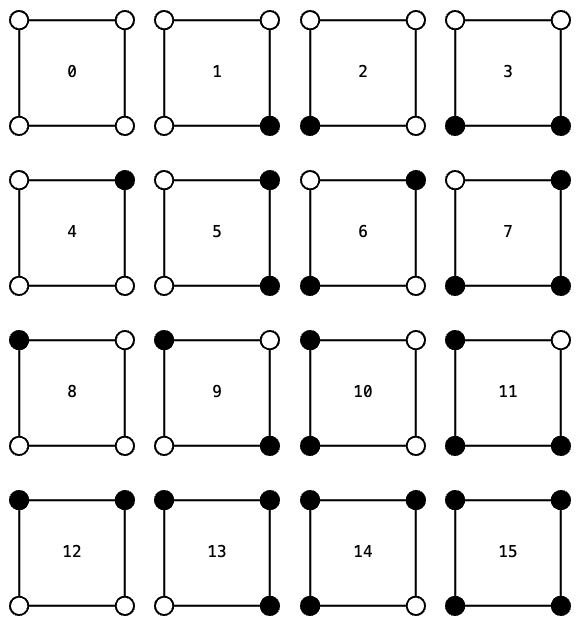
Each cell is defined by the values of the points at its four corners. Since there are 4 points per cell and 2 possible values for each point, there are 16 possible combinations of values. We can represent each of these combinations as a number from 0 to 15. Here's all possible cell configurations, with the number I use to represent them:
 The 16 possible cell configurations
Rendering Tiles
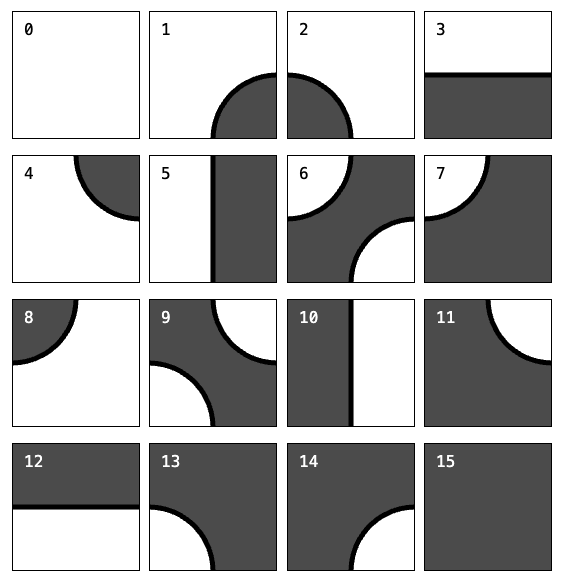
The next step is to render the correct tile for each cell. Marching square tiles are often rendered with straight lines, but I chose to render them as curved, in a style similar to rounded Truchet Tiles. Here's what the individual tiles look like, with the cell number in the top left corner:
 The 16 possible tiles
Each shape above matches a cell configuration from the previous section. The darker portion of each tile represents the "inside" of the shape, and the lighter portion represents the "outside" of the shape. The edges of adjacent tiles line up, so that the shape is continuous across the entire grid.
Rendering the Grid
Now that we can render a single cell, we just need to walk over the entire grid and render the tile for each cell. We start at the top left corner of the grid, and render each cell in order, moving left to right, top to bottom. Here's what the final result looks like:
 A grid of points, with the correct tile rendered for each cell
I added a few options to the renderer, like background color, fill color, line color, and line width, as well as a variable grid size. Plus I can toggle points between 0 and 1 by clicking them. This lets me make some fun shapes:
 Just a little guy
Wrapping Up
I'm actually not new to Marching Squares. I've implemented the algorithm (and its 3-dimensional big brother, Marching Cubes) in Unity a couple of times. This was my first time implementing it in TypeScript, though, and it was a fun exercise.
Like I mentioned above, I looked at a few other things this week, but I didn't get very far with any of them. I looked at things like Model Synthesis, Wave Function Collapse, and built a very simple version of this texture synthesis program, before realizing there is already a great web-based version of it.
All of these use some kind of tiling on a grid, so it seemed at least useful to have a renderer for when I need to visualize a grid in future projects. Plus, it gave me some more practice with canvas rendering in TypeScript.
I'd like to put this project up somewhere, once the code is cleaned up a bit. I'll update this post with a link when I do.
I'll be back next week with another update!